General.Compute.Plugin
This node executes user-provided JavaScript code, thereby enabling the creation of a custom compute node.
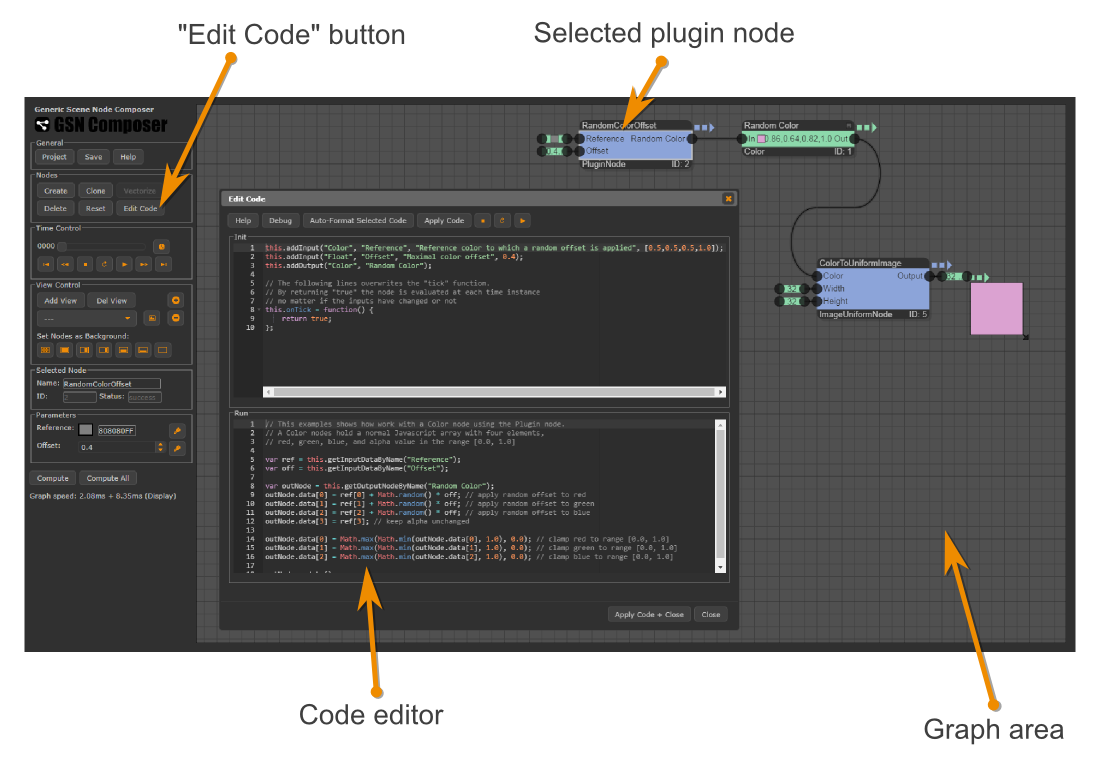
If a plugin node is selected in the graph area, the Edit Code button in the Nodes panel can be clicked. A dialog appears in which JavaScript code can be entered for two functions: init() and run().
- The init() function is called when the node is created (or re-created after a code change). Typically, the main purpose of this function is to define which input and output slots are required for your plugin node.
- The run() function is called each time an input changes. Typically here the required information is read from the inputs, the result is computed, and the outputs are updated with the new result.
When a plugin node is created, it contains default code that implements a simple addition of two floating point values.
Let's have a look at the default init() function:
this.addInput("Float","A", "Operand A", 1.0);
this.addInput("Float","B", "Operand B", 2.0);
this.addOutput("Float", "Result");
The functions addInput(...) and addOutput(...) define the required input and output slots, where the first function argument (here "Float") defines the type of data node that can be connected to that input or output slot. The second argument is the name with which an input or output slot is labelled. It is important that this name is unique, i.e., no two inputs or outputs should have the same name. The third argument is a description that is shown as a tool tip when the user hovers the mouse over a slot or a public parameter's interface element. For public parameter inputs there is an optional fourth argument, which defines their default value (here 1.0 and 2.0).
The corresponding default run() function that implements an addition of two float values is:
var a = this.getInputDataByName("A");
var b = this.getInputDataByName("B");
var resultNode = this.getOutputNodeByName("Result");
resultNode.data = a + b;
resultNode.update();
The functions getInputDataByName(...) in line 1 and 2 return the data of the nodes from the input slots labelled "A" and "B".
The function getOutputNodeByName(...) in line 3 returns the node from the output slot labelled "Result". Please note, that this
variable is now a node (and not the data stored in the node).
Line 4 assigns the data of the output node (which is access by "resultNode.data") the result of the computation.
Line 5 calls the update() function of the output node to inform it that its data has changed.
There is an even shorter option to implement the same functionality using the following run() function:
var a = this.getInputDataByName("A");
var b = this.getInputDataByName("B");
this.updateOutputByName("Result", a + b);
However, this way, there is no access to the previous data of the output node, which is sometimes required. E.g. when the output should only update when the data really changes:
var a = this.getInputDataByName("A");
var b = this.getInputDataByName("B");
var resultNode = this.getOutputNodeByName("Result");
var result = a + b;
if(result !== resultNode.data) {
  resultNode.data = result;
  resultNode.update();
}
Here is another option to achieve the same:
var a = this.getInputDataByName("A");
var b = this.getInputDataByName("B");
var result = a + b;
if(result !== this.getOutputDataByName("Result")) {
  this.updateOutputByName("Result", result);
}
Note, that the used function in line 4 is now getOutputDataByName (which returns the data) and no longer getOutputNodeByName (which returns the output node).
Examples
There are several examples that demonstrate plugin nodes, which are processing different types of data. These examples should be a good starting point for your own plugin.
Editor Features
The code editor has many advanced features which are accessible via keyboard shortcuts.
Debugging
There are three options to debug your plugin code:
- Chrome/Firefox Debugger You can debug your code directly with the built-in debugger of the browser. To this end, add the following two lines to your plugin code:
debugger;
//# sourceURL=my-plugin-run-function.js
Now first open the developer console of Chrome/Firefox (shortcut "F12") and afterwards run the graph with your plugin. Once the first line with the "debugger" statement is reached, the code will be opened in the debugger of the browser. The second line with the sourceURL comment tells the browser how to name the source code in the debugger. You can replace "my-plugin-run-function" with your custom name. The named source is also listed in the source tab of the browser's developer console in the "no domain" section and can be access from there. If you use breakpoints in the source, you can also omit the first line with the "debugger" statement. - External Debugger If you want to use other external tools for plugin development, you can export a debug version of the complete project by pressing the Debug Plugins button in the project dialog. The source code of your plugins can be found in the script section of the generated index.html file. You can open the index.html file with your external tool and edit and/or debug the source.
- Log to Console Sometimes you do not want to break the execution of the code with a debugger. Instead a continuous feedback is required to analyze the code's behavior. In these cases,
your plugin could write debug messages to the browser's developer console, e.g.
console.log("This is the value of a: " + a.toString());
Support
Currently, the GSN Composer's functional range is still constantly expanding and and a suitable node for your particular needs might not yet be included. Therefore, if you are not able to create a Plugin node yourself, you are very welcome to contact me with your request and I will try to create a solution for you.