ImageProcessing.Compute.Color.Histogram
This node computes an image histogram. A histogram contains the number of pixels for each intensity value divided by the total number of pixels. In other words, a histogram contains the relative frequency of intensity values of an image.
As an example, let's asume we have an image with 4 x 3 pixels that has 5 different intensity values:

For this example, the histogram is the vector shown at the bottom right in the figure above. Of the 12 pixels, 2 are purple, 3 are yellow, and so on.
If the selected type = 0 (RGBA), this node computes the histogram separately for all channels of a RGBA image and stores the relative frequencies in the RGBA channels of the output image. If type = 1 (Grayscale), the input image is converted to grayscale and the histogram is computed for the grayscale intensities. Or if type = 2 (Red Channel), the histogram is computed for the first channel of the given image.
The input slot named bins chooses the number of histogram bins. The bins divide the possible range of intensity values [0.0, 1.0] into a series of equally spaced intervals.
The node does not directly return a graphical representation of a histogram. Instead, an image with a height of one pixel and a width that corresponds to the number of bins is computed. The value of each pixel is the relative frequency of intensity values within that histogram bin.
ImageProcessing.Compute.Color.HistogramBars
This node shares the same input slots and produces the same image histogram output as the histogram node described above. However, additionally a graphical bar chart visualization of the histogram is generated.
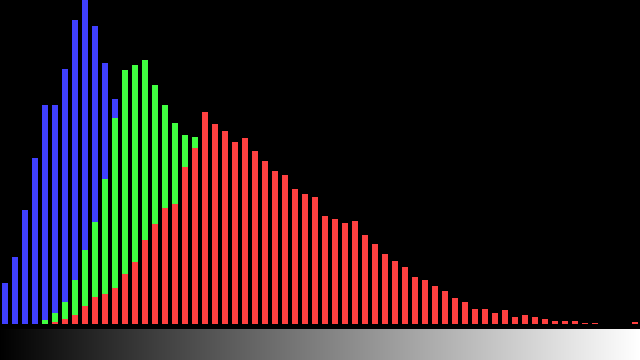
The example HistogramBars demonstrates the usage of this node.